Empowering today's Earth system science
Welcome to the Computational and Information Systems Laboratory (CISL) at NSF NCAR, where we are at the forefront of advancing Earth system science.
Computing, data, and research excellence
CISL is an innovation hub! We offer state-of-the-art computing resources, comprehensive data solutions, and pioneering research services.
Our mission is to empower scientists, researchers, and institutions across the globe with the tools and expertise needed to unlock the mysteries of our planet's complex interconnected systems.
Join us in shaping the future of environmental
understanding and discovery.
learn more
Publications
Recent CISL News
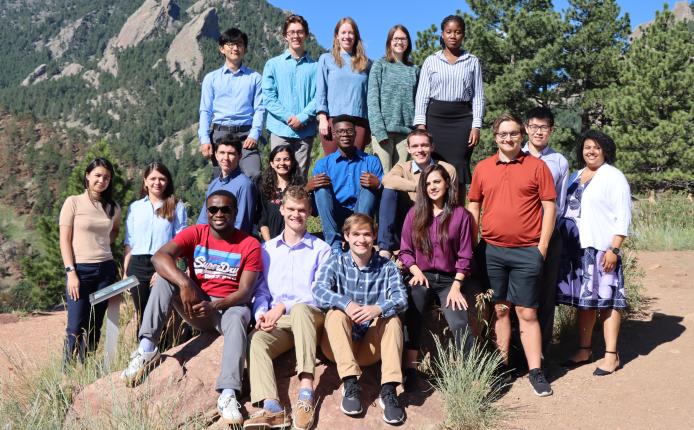
Internships
CISL provides students, educators, and the public with learning experiences and educational tools that teach about the importance of high-performance computing (HPC) in answering questions about our world. Learning opportunities for interns also help diversify our science community while making HPC accessible and fun. Learn more about internship opportunities.